| Measured finding | Condition | Planning use |
|---|---|---|
| 110,000 to 370,000 particles per liter | Three popular bottled-water brands, nanoplastics and microplastics counted together | Treat bottled water as a real source of plastic particles. Each tested brand fell in this range, so brand choice alone is not a fix. |
| 240,000 fragments per liter on average | One-liter plastic bottle, Columbia research as reported | Use it as a reference point for comparing other figures. |
| 90% nanoplastics, remainder microplastics | Share of counted particles in the same research | Most particles are far too small to see, so how the water looks tells you nothing. |
| 39,000 to 52,000 particles per year | Average microplastic intake from food and drinking water, review reported by WIRED | Bottled water is one contributor to a wider baseline from food and drink. |
| Nearly 90,000 more particles per year | People who drink bottled water daily | The clearest reason to reduce daily bottled-water reliance. |
| Long-term health effects unclear | Extensive testing and standard methods are lacking | Do not read a particle count as a risk score. |
Figures come from the UF Health podcast on the Columbia research and WIRED’s report on a review of microplastic intake.
Microplastics in water bottles are measurable: one Columbia University study counted 110,000 to 370,000 particles per liter in three brands, but harm at those levels is not established. Cutting daily bottled-water use is a practical step.
If you are weighing other products and their claims, our guide on is this health product legit sets out a general approach to checking what a label or study really shows.
What the counts mean when you buy bottled water
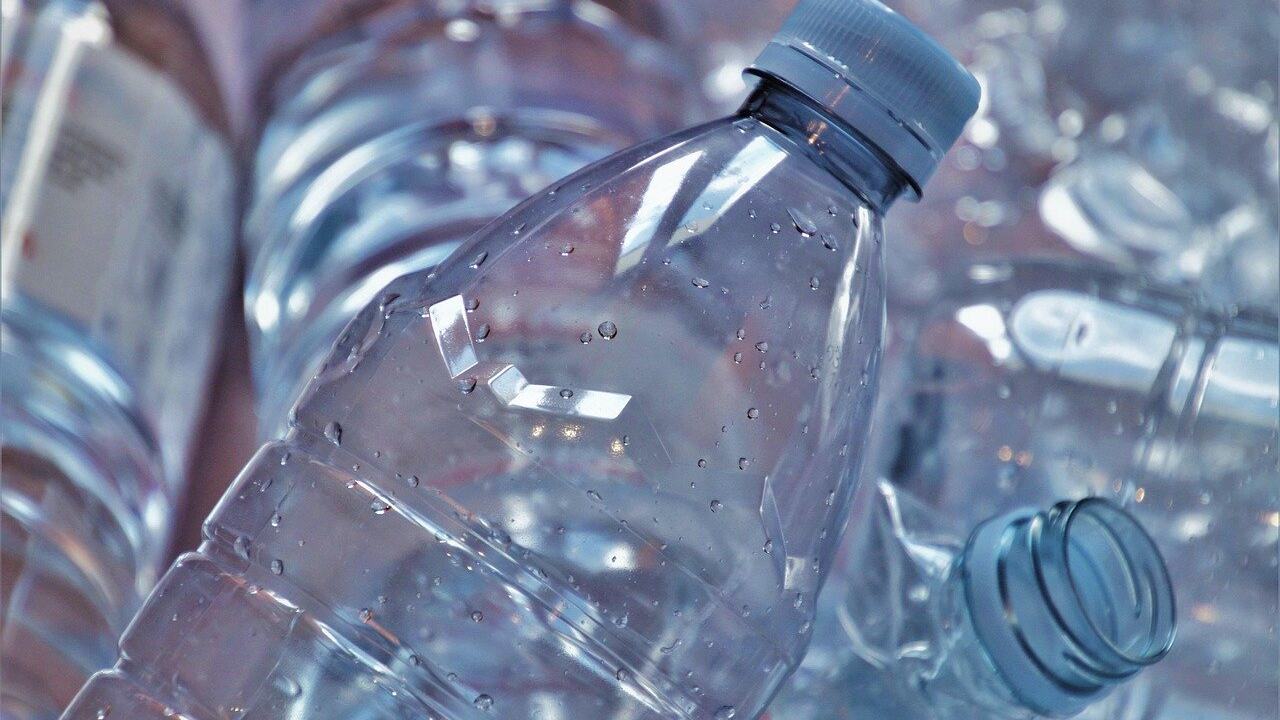
The Columbia University study tested three popular bottled-water brands and found 110,000 to 370,000 particles in each liter, according to the UF Health podcast covering the work. The same coverage reports an average of 240,000 plastic fragments in a one-liter plastic bottle. The top of that range is a ceiling seen in the study, not a typical value, and the average sits well inside it. The spread matters for shoppers: the products differed, and none of the three brands came out particle-free.
Daily drinkers carry the largest reported difference
A review reported by WIRED estimates that people ingest an average of 39,000 to 52,000 microplastic particles per year from food and drinking water. The same report says those who use bottled water on a daily basis ingest nearly 90,000 more particles per year. That gap is the most useful number for deciding what to do. If bottled water is an occasional convenience, it adds little to the picture. If it is your main drinking water at home or work, it is the habit most worth changing first.
These are particle counts, not measures of dose by weight or of toxicity. They tell you how much plastic is present, not what it does in the body.
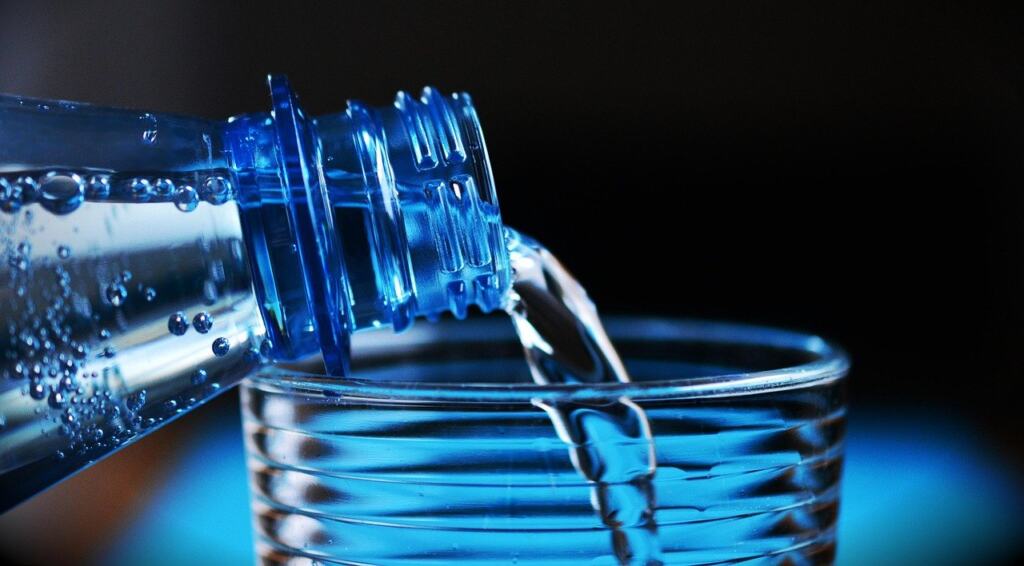
Most counted particles are nanoplastics
In the Columbia counts, 90% of particles were nanoplastics and the rest were microplastics. Nanoplastics are particles less than 1 micrometer long, while a human hair is about 70 micrometers wide. The practical consequence is that clarity, taste and smell cannot indicate particle load. Neither can a quick visual check for flakes, so decisions have to rest on how the water is packaged, stored and how often you rely on it.
Harm: what is measured and what is not shown
The question most readers ask is whether these particles are harmful. The supported answer separates three kinds of statement, and mixing them is how headlines overstate the risk.
- Measured: particle counts, size shares and polymer types in bottled water, as in the Columbia research and the intake review above.
- Reported by researchers: nanoplastics are so small they can pass through the intestines and lungs and go directly into the bloodstream, and some researchers note that these particles can be toxic to humans, according to the UF Health podcast.
- Unresolved: the WIRED report says long-term effects on health remain unclear because of the lack of extensive testing, and measurement methods are not yet standardised.
Taken together, this supports a proportionate response. Exposure is real and measured, and the ability of the smallest particles to enter the bloodstream is a reasonable reason for caution. Proven harm at the levels people actually drink is a separate claim that has not been established. Cutting avoidable exposure is sensible; treating a particle count as a diagnosis is not.
Choices that lower exposure
No threshold has been established for what counts as a safe particle level, so the aim is to reduce avoidable exposure rather than hit a target. The options below suit different habits.
- Cut back daily bottled water. This is the lever with the largest reported effect, since daily users ingest nearly 90,000 more particles per year. It suits anyone who buys cases of bottled water for everyday drinking.
- Keep plastic bottles away from sunlight and temperature swings. Handle them gently too. Plastic bottles are prone to release microscopic debris through sunlight, temperature changes and physical manipulation, according to WIRED. This is the step for people who must keep buying bottled water.
- Use glass or stainless steel for water you carry or store. A non-plastic container takes the plastic bottle out of the picture, which is the route linked to sunlight, temperature change and handling. It suits people who refill from a tap or a larger supply.
- Choose filters on evidence, not assumption. Polyamide, a nylon used in filters, turned up in the bottled-water samples even more often than PET. A filter is not automatically a guarantee of fewer particles, so look for a specific product with evidence for the particle sizes you care about.
Reading labels carefully matters here as it does elsewhere. A BPA-free label addresses an additive rather than particle shedding, and our explainer BPA Free Meaning: What “BPA‑Free” Really Means For Your Health In 2026 – Testpledge covers what that claim does and does not tell you. The same habit of questioning marketing terms applies to kitchen products, as in PFAS-Free Parchment Paper: How To Choose Safe, Nonstick Baking Paper In 2026 – Testpledge.
Why bottled water carries particles
PET and polyamide dominate what was identified
The Columbia researchers looked for seven known types of plastic. A common find was polyethylene terephthalate (PET), the plastic used in many water bottles, and even more prevalent was polyamide, according to the UF Health podcast. Those seven known types accounted for only about 10% of the nanoparticles spotted. In plain terms, the bulk of the nanoscale particles were not matched to the plastics the team searched for, so the bottle alone is not a complete explanation of what ends up in the water.
Release from the bottle itself
Plastic bottles shed debris when exposed to sunlight, temperature changes and physical manipulation, per the WIRED report. That mechanism makes the history of a bottle relevant: how long it sat, where it was kept and how it was handled all plausibly change what a given bottle contains, which is one reason brand averages can mislead.
Why studies report different numbers
Measurement is a real limit on comparison. Some methods can detect extremely small particles but cannot determine their chemical composition, while others miss the smallest particles. A study that counts nanoscale particles will report far higher numbers than one limited to larger fragments, and a study that identifies chemistry will report fewer confirmed plastics than a pure particle count. When you compare two figures, check the size range counted and whether polymer types were confirmed before deciding that one source of water is worse than another.
Frequently asked questions
How big is a microplastic compared with a nanoplastic?
Microplastics range from 1 micrometer up to 5 mm. Nanoplastics fall below that range, so they sit at the smallest end of the particles discussed in bottled-water research.
Can I treat 240,000 particles per liter as the figure for any bottle?
No. It is the average reported for a one-liter plastic bottle in the Columbia research, which tested three brands and found 110,000 to 370,000 particles per liter. Counts also depend on the measurement method used.
What should I check when a headline reports microplastics in a product?
Check the unit, such as particles per liter or per year, and which size range was counted. Then see whether any health outcome was measured. Counts describe exposure, and harm is a separate question that long-term evidence has not yet settled.